Making Sense of Quantum Sensing
An RnD landscaping effort part of Center of Excellence pre-study Quantum STREAMS
What this is
01
Scoping Quantum Sensing
02
Going Subsymbolic
03
Reslicing the pie
04
Adding temporal dimension
05
Mapping geographies
06
Collaborative patterns
07
Clusters appear
08
From research to market
09
On Process
10
01 What this is
In the making
In late 2025, as the Swedish innovation ecosystem began aligning around what may be its most ambitious coordinated effort to date, a constellation formed to explore a cluster of excellence in quantum sensing. The landscaping presented here was conducted in support of that effort.
02 Scoping Quantum Sensing
First Shot
Quantum sensing is often described as one of three pillars of quantum technology, alongside computing and communication. In practice, however, the techniques involved—measurement, control, estimation, readout—form the substrate on which all quantum technologies depend. Rather than treating it as one branch among others, we treat it here as closer to the trunk of the tree: the set of practices that make quantum systems measurable and usable. In keeping with this view, we began by casting a broad net, using the following search string:
—
—
quantum OR photon* OR qubit*
—
NEAR/3
—
acceleromet* OR coheren* OR control* OR correlation* OR dot OR dots OR dynamic* OR entagl* OR “error correction” OR estimat* OR dynamics OR feedback* OR “fisher information” OR hamiltonian* OR imag* OR information OR interfer* OR magnetomet* OR measur* OR metrolog* OR noise* OR optic* OR precision OR sensor* OR sensing OR “signal process*” OR simulat* OR stabiliz* OR state OR squeez* OR “system identification” OR yield*
—
—
OR
“photon count*” “photon detect*”
“spin dynamic*”
To ground the initial set, we complement this lexical approach with an actor-based one. Starting from researchers in the consortium, we trace their publication records and extend outward through co-authorship networks. This yields a second corpus—defined by collaboration—of comparable size. The overlap is partial, but the similarity in scale suggests that both approaches are circling the same territory from different directions.
When mapped against the Web of Science taxonomy, it resists neat capture within standard disciplinary boundaries.
Plotting the resulting corpus against the Web of Science taxonomy reveals a domain that resists neat capture within standard disciplinary boundaries.
03 Going Subsymbolic
Connecting dots
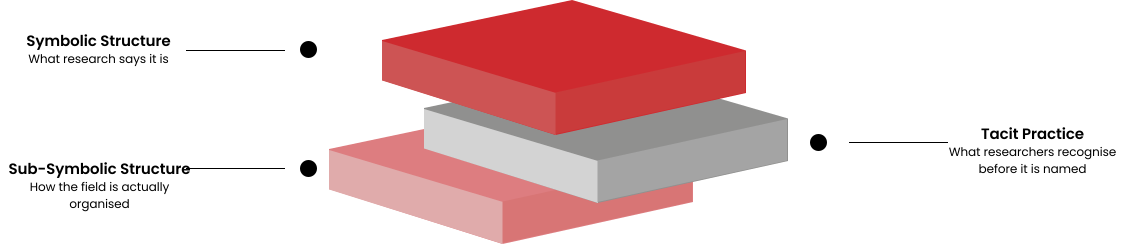
We then move from a bibliographic to a semantic representation. Each publication is encoded as a numerical vector—an embedding—positioned in a high-dimensional space where similarity reflects shared content rather than shared metadata. Papers that speak about similar phenomena cluster together, regardless of where they sit in a conventional taxonomy.
This shift also makes it possible to filter the initial set. A number of outliers—drawn in by broad search terms but not meaningfully connected to quantum systems—fall away at this stage. What remains is a more coherent landscape, shaped by semantic proximity rather than keyword coincidence.
Projected down into two dimensions, this structure becomes visible as a topological map of proximity, density, and isolation across lines of work.
The labels above the cloud, by contrast, derive from a conventional taxonomy, where each paper is assigned to a predefined disciplinary category. Together, these layers produce a hybrid view.
04 Reslicing the pie
Our own dimensions
The next view allows the user to choose which semantic dimensions occupy the x- and y-axes, producing more granular slices of the landscape. Papers that belong together tend to cluster under some projections, while others reveal clearer separation.
The aim is not to fix a single “correct” view, but to make it possible to explore how structure appears under different perspectives.
05 Adding temporal dimension
Bubbles under disguise
We then shift the object of study—from papers to researchers, and further to institutions—while introducing a temporal axis. The values shown are cumulative and unfold over time, allowing trajectories to be traced rather than inferred.
As the timeline advances, positions stabilise, clusters form, and shifts become legible. What was previously a static map begins to resolve into a dynamic landscape of activity and accumulation.
06 Mapping geographies
Where does it happen?
Extending the temporal view, we map the field’s centres of gravity at the national level, and trace patterns of international co-authorship. Activity concentrates unevenly, revealing a small number of dominant hubs alongside a longer tail of smaller contributors.
At the same time, the collaboration network makes visible how these centres are connected—where ties are dense, where they are sparse, and how they evolve over time. In this view, publications with fewer than ten citations are excluded, resulting in a slightly reduced set.
07 Collaborative patterns
One is not alone
We then move from geographic and network views to a relational one, focusing on how collaboration is distributed between institutions. Each arc represents an organisation, with its size reflecting overall activity. Connections between them indicate co-authored work, with thickness corresponding to the strength of the collaboration.
Selecting an institution brings its partnerships into focus, allowing individual relationships to be inspected in more detail. The accompanying metrics—number of papers, citations, and citations per paper—provide a simple measure of scale and impact for each connection.
08 Clusters appear
You're who you surround yourself with
This view brings the different layers together into a single representation. Papers and institutions are embedded in the same semantic space, while links indicate collaboration. Colour and size can be used to highlight different attributes, and the temporal dimension remains available through the timeline.
At this level of aggregation, structure begins to stabilise. Groups of closely related work—often spanning multiple institutions—appear as dense regions in the graph. When enabled, halos trace these regions, offering a tentative outline of what may be understood as clusters of excellence.
To make this structure more legible, we introduce three working sub-domains—Detection & Metrology, Life Science Imaging, and Position, Navigation & Timing. These are not drawn from any formal taxonomy, but serve as pragmatic lenses for navigating the space, consistent with the framing established in the prestudy.
09 From research to market
Where research ends up
We then extend the view beyond research into the emerging innovation landscape. Companies are mapped alongside universities, allowing early signs of translation and spin-out activity to be explored geographically.
The map is generated dynamically and updated continuously, drawing on automated sources that interpret how organisations describe themselves. This makes it possible to follow the landscape as it evolves, rather than relying on static snapshots.
An additional aim is to begin linking companies back to their academic origins, tracing potential lines of descent from research environments to entrepreneurial activity. While still incomplete, these connections offer a first indication of how the underlying research base is beginning to materialise in practice.
10 On Process
How we made it
The work behind this report was led by KTH Innovation, in close collaboration with Klared.
Our research primarily relied on OpenAlex to collect academic documents. As an open-access database, it indexes over 400 million scientific works from reliable sources like Crossref, ORCID, and PubMed.
We also integrated Semantic Scholar, an AI-driven search engine which uses machine learning to understand the meaning of texts, find connections between articles, and improve search accuracy. To ensure our data collection was rigorous and complete, the KTH Library team validated the entire process.
Next, to analyze the relationships between the articles and their subject areas, we used SPECTER2 embedding models. Considered state-of-the-art for representing scientific literature, these models are trained across 23 fields of study to generate highly accurate data representations adapted to complex scientific contexts.
Finally, we created interactive visualizations to explore this data using the D3.js library alongside d3fc. This technology stack, which includes WebGL optimization, allowed us to smoothly and efficiently render massive networks of data directly in any web browser.